Problem Statement
Autism is characterized primarily by social and behavioral challenges, including: differences in how people perceive their environments and those around them, communication barriers due to how people both process and verbalize information, and the need to maintain rigid patterns and rituals that can interfere with quality of life. Autism is most often diagnosed in toddlers, but some individuals on the autism spectrum disorder (ASD) are classified as “high-functioning” and can go undiagnosed into adulthood. There are currently no standard diagnostic criteria for adults with suspected ASD, but they are in development (as of 2018). Waiting times for an adult to receive an autism diagnosis are lengthy and procedures are not cost effective, often requiring multiple visits and interactions with clinicians. A short and effective diagnostic screening tool is needed to reduce the burden of cost and time of adults who are undiagnosed with ASD.
Proposal
Using the Adult Autism Screening dataset, I will create a random forest model that will evaluate various features within the data to predict if an individual has autism. This is a supervised learning problem, with the target variable of Class/ASD having two levels: YES and NO. Since the dataset already contains the true values of the target variable, I will be splitting the data into a test set and a train set. I will use recall, precision, and f1 score as the metrics to judge the efficacy of my models.
Also, I plan to use the area under the ROC curve to determine the appropriate threshold for the classifier. My aim in doing this is to reduce the false positive rate of the model. A false diagnosis for autism could result in unnecessary and costly follow-up for the individual, as well as the use of resources for someone who does not require them.
The model will then be able to provide a quick screening tool that can be used to determine whether a person may have autism and should seek guidance on its management. This will reduce the effort needed to diagnosis adults with ASD and allow for quick treatment options for the patients.
Exploration of the Data
To gain an understanding of the data with the ASD dataset, I inspected the variables that were available, then performed rudimentary cleaning and visualizations. The binary variables came in different formats, so I standardized all binary variables by making the values used to be 0 or 1 (for gender, male is 1). I decided to remove some of the variables due to a lack of relation to the target variable, such as prior usage of the app or relation of the person completing the survey to the screened individual (self or family) or redundant data, such as a description of age in addition to a variable for age as well.
It is important to note that the ‘result’ was removed as well. The result variable is the summation of yes answers from all 10 question variables. The reason for the removal is because the correlation between this variable and the target variable was a little over .82, which trivialized all other variables. Thus, it was removed to allow for a more detailed exploration of the remaining variables.
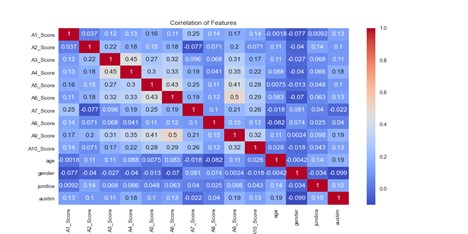
After this point, the data was separated into training and test sets for both the feature and target variables. I created histograms for the age and questionnaire scores from the training features, which helped to find an outlier whose age was recorded as 383. A heatmap visualization of the correlation between all the feature variables shows the highest correlation between several of the question variables. The A_Score variables are the answers to the questions in the questionnaire, age and gender are self-explanatory, jundice is if the subject was born with jaundice, and autism is whether or not there is a family history for autism.
Model Preparation and Evaluation
The features of my dataset comprise of two types: binary and nominal. Originally, I ran all the binary variables, of which there are 13, through the SelectKBest function in the sklearn library. I specified the test as chi-squared and kept the 10 best variables. However, this not only left it up to me to determine the appropriate k value, but also left out the ‘age’ variable. I decided to use recursive feature elimination with cross validation to determine what variables were the best to keep. Since I have a supervised binary classification problem, I used a logistic regression model and looked at the area under a ROC curve to determine which of the variables to eliminate. This is done by removing one variable at a time until the model score is negatively affected by the removal. After the feature elimination, the variables that remained in the training set were the A_Score variables and no others.
A standard scaler was created and fit to the features of the training data, and then the features of the both the training and testing data were transformed into standardized features with a zero mean and variance with normal distribution. Then the random forest model object was created, then fit with the standardized features of the training set and the training target data. Predictions were made using the model on the testing features and stored as a separate variable. The predictions were scored against the true values using a variety of metrics: precision, recall, and f1 score.
Model Results
The results of the model predicting autism were 0.968, 0.789, and 0.870 for precision, recall, and f1 scores, respectively. The high precision score indicates that when the model predicts that a subject is predicted to have ASD, it is almost right every time. The recall score is lower than the precision score, which is expected given that the model is pessimistic (it will only predict a subject has ASD if it is very sure). The f1 score acts as a balance between both precision and recall, taking both into account for its scoring.
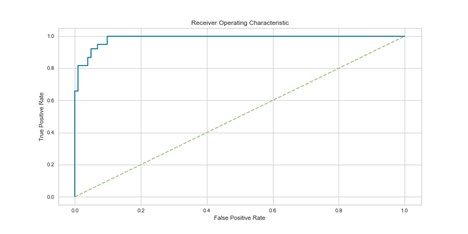
The ROC curve above shows how many values are predicted positive correctly against ones that are predicted incorrectly. A perfect curve would go straight up, and then to the right with no deviations. The closer the area of the curve comes to 1, the better the model. The area under the curve was at first 0.89, but by taking all possible thresholds (the value that determines if a predicted value is positive or not) into account, the area under the curve was improved to 0.99.
Conclusion
Achieving a formal diagnosis for autism is an obstacle that people face when trying to seek guidance on difficulties that they are having which may be related to ASD. Using a random forest model in conjunction with the questionnaire containing the 10 yes or no questions can serve as a quick screening tool for detecting autism within the adult population. The pessimism of the model means that a positive diagnosis of the test is highly likely to be accurate and thus not generate any unnecessary costs for incorrect diagnoses. This can allow adults with undiagnosed autism access to tools and treatments to help them achieve a better quality of life. Both the model and questionnaire can be modified in future to account for the growing awareness for ASD and more detailed diagnostic criteria.